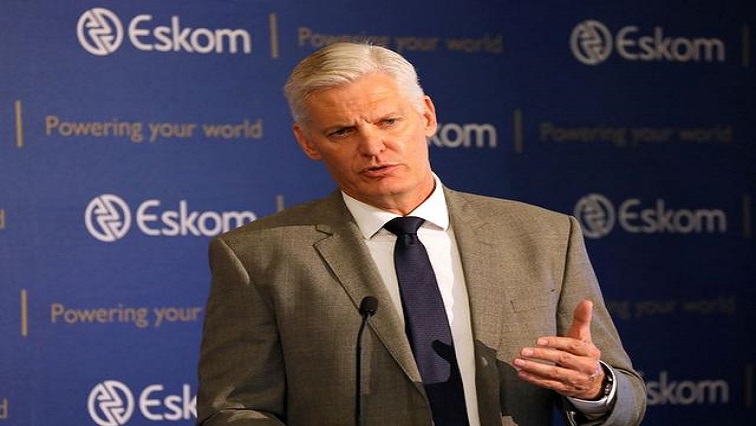
Worst load shedding since 2007 under Eskom CEO Andre de Ruyter

Worst load shedding since 2007 under Eskom CEO Andre de Ruyter. The Council for Scientific and Industrial Research (CSIR) released a new report which shows that South Africa experienced the worst load-shedding since 2007 under Eskom CEO Andre de Ruyter.
The CSIR’s half-year update of its statistics on utility-scale power generation revealed that 2020 was South Africa’s worst year of rolling blackouts to date with 1,798GWh of energy shed and 859 hours of outages.
This record-setting load-shedding happened despite De Ruyter telling the nation that their outlook for the winter season showed little to no load-shedding.
He said in May 2020 that if stage 1 or stage 2 load-shedding were required, these power cuts would probably only be implemented in the evening.
Many energy experts said De Ruyter was misguided and out of touch with what was happening on the ground at Eskom. They were proven right by the CSIR’s data.
The bad news is that 2021 started off even worse with 1,284GWh of energy shed and 650 hours of outages in the first six months of the year.
It means that 76% of the total load-shedding experienced during 2020 was already recorded in the first half of 2021.
The CSIR said the extent of load-shedding experienced was largely driven by the existing coal fleet’s declining energy availability factor (EAF).
The energy availability factor shows the percentage of Eskom’s generation capacity which is available, taking into account planned maintenance and unplanned breakdowns.
The EAF was 61.3% for the first half of 2021, lower than the 65% EAF in 2020 and 66.9% in 2019.
A concerning shift of the unplanned outage component of the EAF has also been highlighted, where unplanned outages of up to 15,300MW were experienced in the first half of 2021.
Responding to the higher load-shedding under De Ruyter, Eskom spokesperson Sikonathi Mantshantsha said it was expected.
“Eskom has consistently explained that the amount of maintenance work, which necessitates available capacity be reduced to conduct maintenance, would bring about the increased risk of load-shedding,” said Mantshantsha.
“No doubt you will still see some load-shedding after the winter period, during the maintenance season.”
He added that Eskom had kept load-shedding to a minimum during the highest demand period in winter. Eskom supplied, on average, 35,000MW — higher than the average 27,000MW during the last quarter of 2020.
The table below gives an overview of load-shedding levels between 2007 and 2020 and the CEOs during these periods.
The 2021 data has been annualised to make it easier to understand the concern from the CSIR researchers about the comparative yearly load-shedding levels.
| Load-shedding in South Africa | |||
| Year | Duration of outages (hours) | Energy Shed (GWh) | Eskom CEO |
| 2007 | – | 176 | Jacob Maroga |
| 2008 | – | 476 | Jacob Maroga |
| 2009 | 0 | 0 | Jacob Maroga |
| 2010 | 0 | 0 | Brian Dames |
| 2011 | 0 | 0 | Brian Dames |
| 2012 | 0 | 0 | Brian Dames |
| 2013 | 0 | 0 | Brian Dames |
| 2014 | 121 | 203 | Brian Dames/Collin Matjila |
| 2015 | 852 | 1,325 | Tshediso Matona/Brian Molefe |
| 2016 | 0 | 0 | Brian Molefe/Matshela Koko |
| 2017 | 0 | 0 | Johnny Dladla/Sean Maritz |
| 2018 | 127 | 192 | Phakamani Hadebe |
| 2019 | 530 | 1,352 | Phakamani Hadebe/Jabu Mabuza |
| 2020 | 859 | 1,798 | Andre de Ruyter |
| 2021* | 1,300 | 2,568 | Andre de Ruyter |
| *Annualised |
Source MyBroadband


